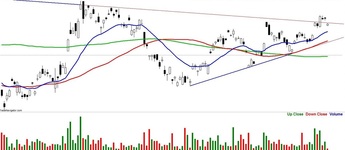
If you want to know how to use the charts you see on Bloomberg, ANC, and other business news channels to make wise investment decisions, you need to learn technical analysis. Technical analysis is a skill used by traders worldwide to time their entry into the market, as well as to pick which stocks to buy. This discipline can be applied in trading stocks, forex, or even commodities like gold and silver.

COURSE OUTLINE
Part 1: The Logic Behind Technical Analysis
Part 2: Price Charts - Starting Point of Technical Analysis
* Market Structure
* Trends in Action
* Moving Averages & Trends
* Support/Resistance
* Trend/Moving Averages/Support Resistance
Part 3: Pattern Recognition Price Charts
* Continuation Patterns ( trend continues)
* Reversal Patterns ( trend changes)
* Recognizing Patterns
Part 4: Candlestick Patterns Simplified
* Battle of Supply/Demand
* Two Basic Candlesticks
* Well Bid or Offered (energy candles)
* End of Momentum
Part 5: Indicators
Part 6: Setting up your Charts and Indicators
APPLIED
Part 7: Exercises
Part 8: Trading Plan (Entry/Exit)
Part 9: Simulated Trading
